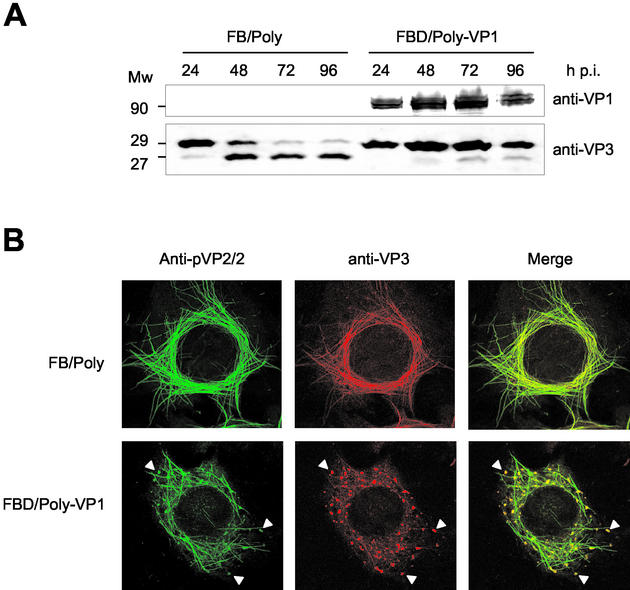
FIG. 8.
Characterization of effect of VP1 coexpression on VP3 proteolytic processing and subcellular distribution of capsid proteins. (A) Detection of VP1 and VP3 polypeptides that accumulated in FB/Poly- and FBD/Poly-VP1-infected cells. Infected cells were harvested at 24, 48, 72, and 96 h postinfection. The samples were analyzed by Western blot with anti-VP1 and -VP3 sera, followed by addition of horseradish peroxidase-conjugated goat anti-rat immunoglobulin. The signal was detected by enhanced chemiluminescence. The position of molecular mass markers (in kilodaltons) are indicated. (B) The subcellular distribution of pVP2/VP2 and VP3 polypeptides in cells infected with FB/Poly and FBD/Poly-VP1 was analyzed by confocal laser scanning microscopy. At 60 h postinfection, cells were fixed and incubated with rabbit anti-pVP2/VP2 and rat anti-VP3, followed by incubation with goat anti-rabbit immunoglobulin coupled to Alexa 488 (green) and goat anti-rat immunoglobulin coupled to Alexa 594 (red). Arrowheads indicate the positions of viroplasm-like areas containing pVP2/VP2 and VP3.

