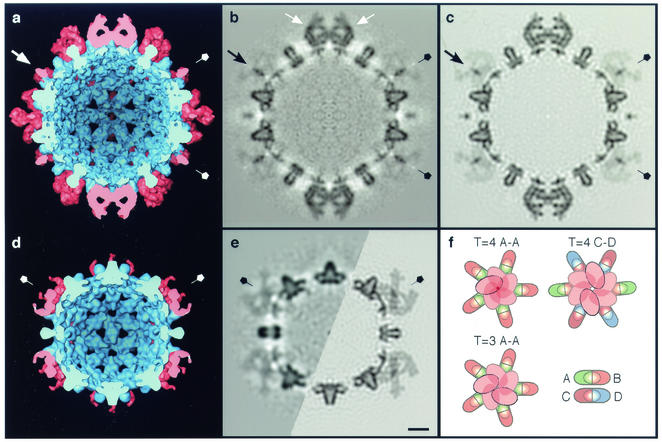
FIG. 2.
Interior views of cryo-EM density maps of HBV capsids labeled with Fab 3120, as represented by surface rendering (a and d) and in central sections (b and e [left half]). (a and b) T=4 capsid; (d and e) T=3 capsid. The capsids are viewed along a twofold axis of symmetry. (a and d) Capsid protein is blue, and Fab-derived density is pink. In the sections, protein density is dark. The corresponding sections from the quasi-atomic models, as limited to the same resolution as the T=4 reconstruction, are also shown (c and e [right half]). Note the close match between the cryo-EM density and the modeled density (cf. panels b and c and the left and right halves of panel e). (b) The two Fabs bound at C-D epitope sites on the T=4 capsid are marked in with white arrows. (a to e) Fivefold symmetry axes are labeled with pentagons. One example of the axial pencil of density on the T=4 fivefold axis is marked with a black arrow (b and c) or a white arrow in (a). (f) Schematic diagrams of the steric exclusion patterns at the fivefold vertices of both capsids (T=4 and T=3 A-A sites) and at the twofold axis of the T=4 capsid (T=4 C-D site) are shown. Bar = 50 Å (a to e).

