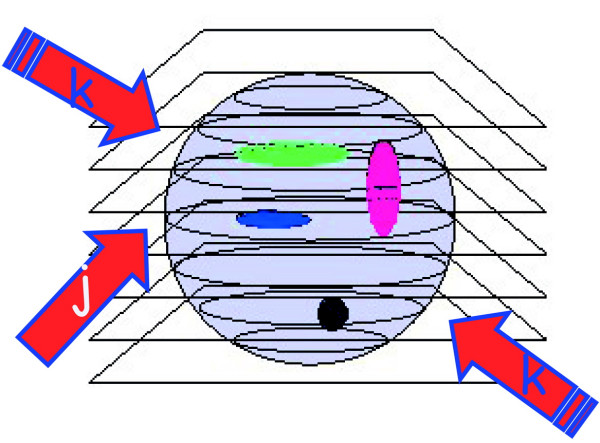
Figure 2.
Optical sectioning scheme. A three-dimensional sample can be sketched as a series of optical slices. Let's call slice j the one containing the geometrical focus of the objective and refer to the adjacent planes as k slices. The sample contains a three-dimensional distribution of fluorescently labelled molecules whose intensity distribution is I, slice by slice. The thickness of each optical slice is approximately one half of the axial resolution, say ≈λ/2.

