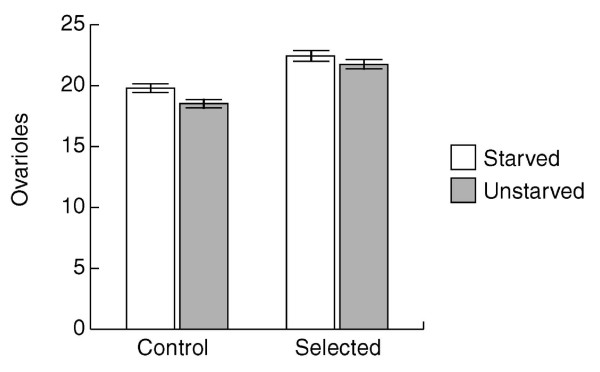
Figure 1.
Grand average of sum of ovarioles for both ovaries, for selected (Si, right) and control (W, left) lines. The grand average was the overall mean for the five selected and five control lines; the standard error is based on the number of replicate selection and control lines. The experimental treatment was maternal starvation for either 28 hours or 32 hours (starved, shaded bars) compared to no maternal starvation (unstarved, open bars). The progeny of these females were used for ovariole number determination. The females ("dams") subjected to the experimental treatment were two generations removed from the selection regime as described in the Ovariole number section of the Methods or in the Results section. Significant differences between linetypes, but not between line (linetypes), are the same if flies are zero, one or two generations removed from selection.

