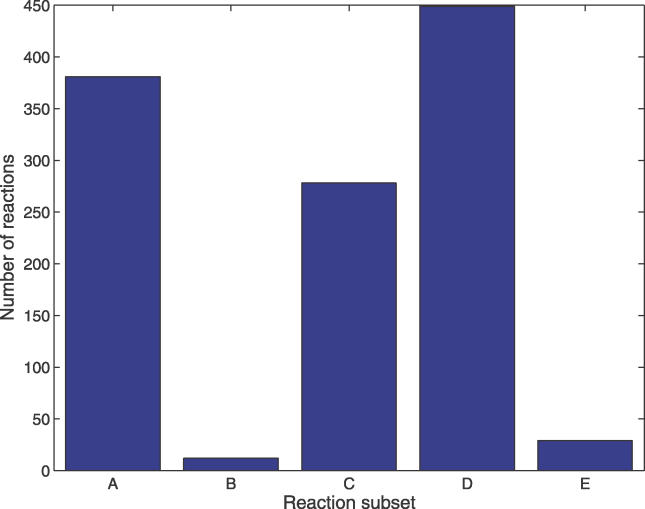
Figure 1. Distribution of the 1,149 Modelled Metabolic Reactions according to Their Variability within the Space of Optimal Solutions for YPD.
(A) Reactions with flux equal to zero in all optimal solutions.
(B) Reactions with the same, nonzero value in all optimal solutions.
(C) Reactions with low variability among optimal solutions (flexbility score between 0 and 10−2).
(D) Reactions with medium variability among optimal solutions (flexbility score between 10−2 and 1/2).
(E) Reactions with high variability among optimal solutions (flexibility score at least 1/2).

