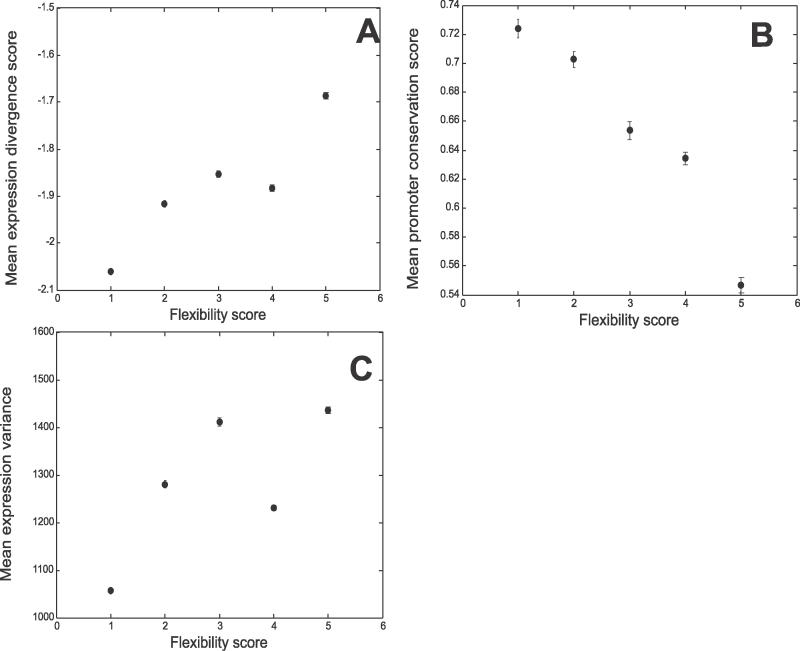
Figure 2. Correlation of YPD Flexibility Score with Biological Measurements Reflecting Constraints on Regulation.
(A) Mean expression divergence (from Townsend et al.) as a function of the gene's flexibility score;
(B) Mean promoter conservation score (based on Harbison et al.) as a function of the gene's flexibility score;
(C) Mean expression variance (from Ihmels et al.) as a function of the gene's flexibility score.
Genes are binned according to their flexibility score into five bins, such that each bin contains the same number of genes. Plot-points represent mean y-axis values over these bins. Error bars depict mean standard error.
Importantly, the correlations reported in the main text are computed from the raw data. The Spearman rank correlation of the binned data displayed here is 0.9 (A and C), and −1 (B).

