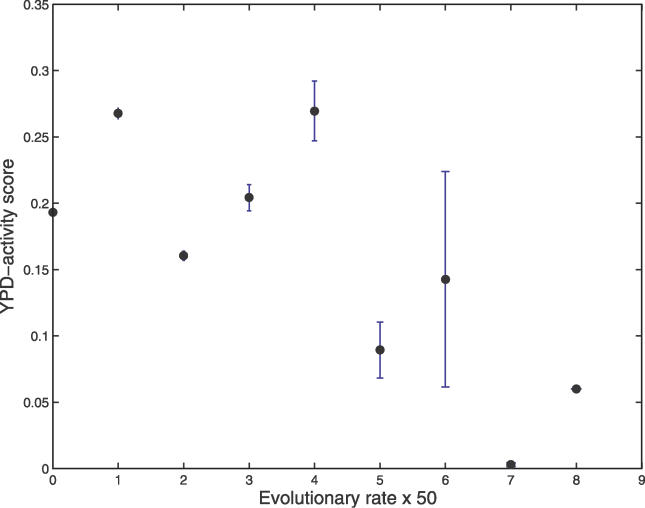
Figure 3. Average YPD Activity Score as a Function of a Gene's Evolutionary Rate.
Genes are binned by multiplying their evolutionary rate by 50, and rounding to the closest integer. The mean YPD activity score over each subset is depicted. Error bars describe mean standard deviation.
Importantly, the correlations reported in the main text are computed from the raw data. The Spearman Rank correlation of the binned data displayed here is −0.71.

