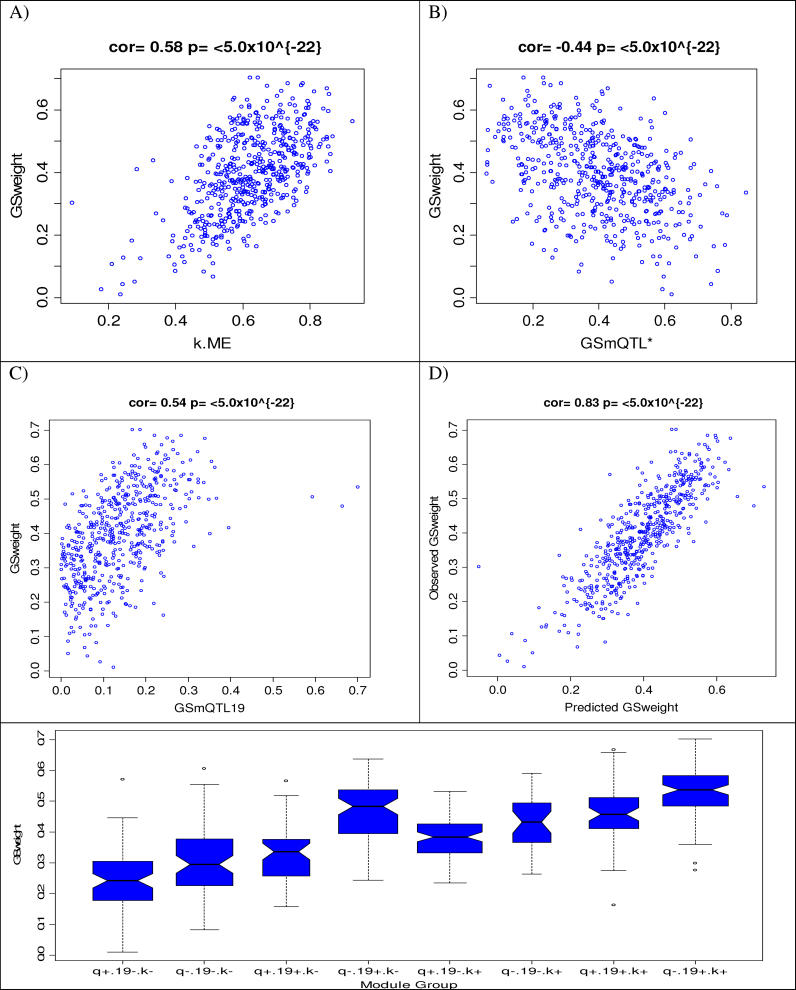
Figure 4. Relating the Gene Significance Measure for Weight (GSweight) to Genetic and Network Based Variables of the Blue Module.
(A) Scatterplot between GSweight (y-axis) and intramodular connectivity (kme) based on the module eigengene (x-axis). Each point corresponds to a gene in the Blue module.
(B) Scatterplot between GSweight (y-axis) and the sum of the mQTL significance measures of Chromosomes 2, 5, and 10 (GSmQTL* = GSmQTL2 + GSmQTL5 + GSmQTL10a).
(C) Scatterplot between GSweight (y-axis) and the mQTL significance measure of Chromosome 19 (GSmQTL19).
(D) Scatterplot between GSweight (y-axis) and the predicted value based on a multivariable regression model involving intramodular connectivity (kme) and the aforementioned mQTL significance measures (GSmQTL* and GSmQTL19). The linear regression model explains 70% of the variation in GSweight.
(E) Boxplot for visualizing the effect of the module based variables on GSweight. The 8 different boxplots correspond to the eight groups of genes that result by splitting the module variables by their median values. Genes with high/low GSmQTL* values are labeled by q+ and q−, respectively. Genes with high/low GSmQTL19 values are labeled by 19+ and 19−, respectively. Genes with high/low connectivity values are labeled by k+ and k−, respectively (For example, the boxplot labeled q+ 19− k− plots the GSweight distribution of the Blue module genes with a high GSmQTL*, a low GSmQTL19, and a low connectivity).

