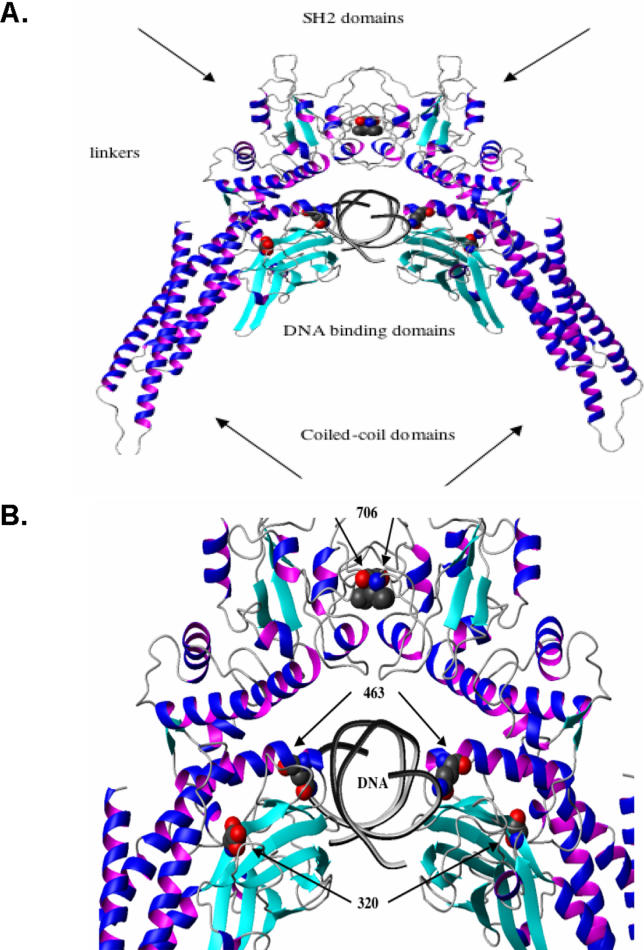
Figure 3. Molecular Representation of STAT1 Mutants.
(A) Ribbon representation of the WT STAT1 homodimer complexed with DNA. Secondary structure elements representing the β strands are shown in cyan, and the helices are shown in blue-magenta. Atoms of residues in mutated positions L706, E320, and Q463 (indicated by arrows) are shown in space-filling models. Atoms are shown in red (for oxygen), blue (for nitrogen), and gray (for carbon).
(B) Magnified focus on the region containing the three mutated residues.

