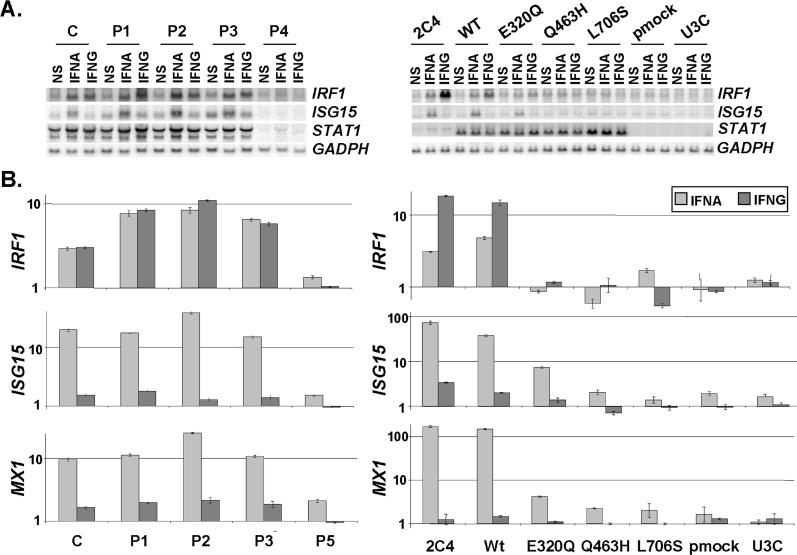
Figure 7. Impact of STAT1 Mutations on Transcription.
(A) Levels of mRNA corresponding to STAT1, IFNG- and/or IFNA-inducible genes (IRF1 and ISG15) and GADP in EBV-transformed B cells from a control (C), the three affected individuals (P1, P2, and P3) and a STAT1-deficient individual (P4), or in the 2C4 parental fibrosarcoma cell line, STAT1-deficient U3C cell line, and U3C cells stably transfected with a mock (pmock), WT, E320Q, Q463H, or L706S STAT1 allele, either not stimulated (NS), or stimulated for 2 h with 103 of IFNG or 104 of IFNA for EBV-transformed B cells and 105 IU/ml of IFNG or IFNA for fibroblasts, as detected by Northern blotting.
(B) Relative real-time PCR of IRF1, ISG15, and MX1, and cDNAs from EBV-transformed B cells derived from a healthy control (C), three patients under study (P1, P2, P3), and a patient with recessive complete STAT1 deficiency (P5) homozygous for the 1928insA STAT1 mutation or from parental fibrosarcoma cell line (2C4) and STAT1-deficient U3C fibrosarcoma cell clones, untransfected (U3C) or stably cotransfected with a zeocin-resistance vector and a vector containing a mock, WT, E320Q, Q463H, or L706S STAT1 allele stimulated or not stimulated with 105 IU/ml of IFNG or IFNA for 1 h and 2 h for EBV-transformed B cells and fibroblasts, respectively, for IRF1, and for 6 h for both cellular types for ISG15 and MX1. Means values of duplicates of one experiment are shown with their respective standard variations.

