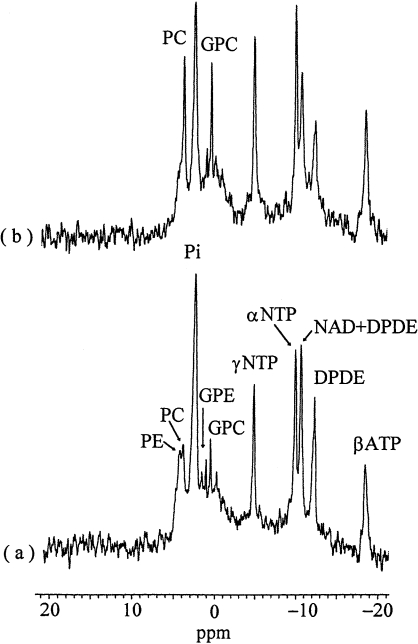
Figure 2.
31P NMR spectra of perfused DA3 cells at 37°C. (a) Controls; (b) 1 hour after perfusion with 100 ng/ml HGF/SF. For acquisition parameters, see Materials and Methods section; line broadening=20 Hz. PE, phosphoethanolamine; PC, phosphocholine; Pi, inorganic phosphate; GPE, glycerophosphoethanolamine; GPC, glycerophosphocholine; NTP, nucleoside triphosphate; NAD, nicotinamide dinucleotide; DPDE, diphosphodiester. Note the remarkable increase of the PC and GPC signals following exposure to HGF/SF. No phosphocreatine signals were found in these spectra.

