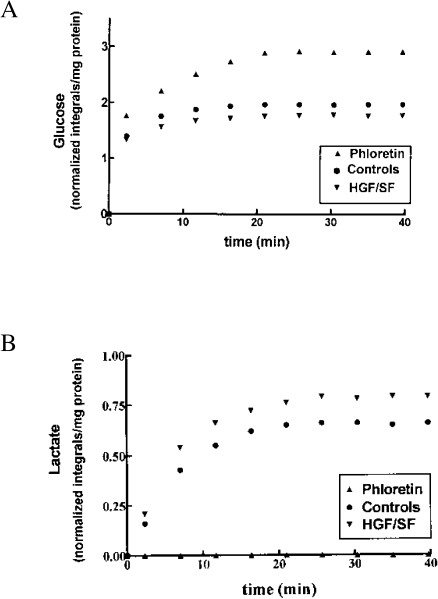
Figure 5.
13C NMR kinetic measurements of glucose utilization (A) and lactate formation (B). Controls — cells were perfused with [13C1]-glucose-enriched medium and 13C spectra were continuously recorded. HGF/SF — following a complete washout for 60 minutes with normal medium, the cells were perfused with DMEM containing 100 ng/ml HGF/SF for 60 minutes and the 13C NMR experiment was repeated. Phloretin — following a second complete washout with normal medium, the cells were perfused with DMEM containing phloretin (200 mM) and the 13C NMR spectra were recorded again on the same sample. The time scale starts at the point at which [13C1]-glucose reached the cells. Results of one out of three different experiments are shown. Metabolite levels were determined by normalizing NMR signals integrals to the reference (dioxane in a capillary), and to the protein content of the cell.

