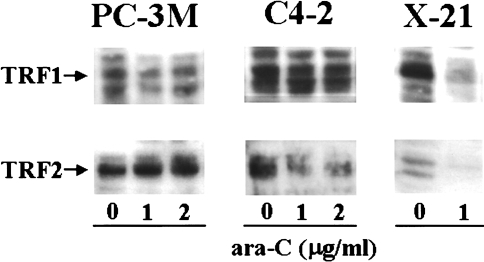
Figure 6.
Protein levels of TRF1 and TRF2 of prostate cancer cell lines PC-3M and C4-2 and mouse melanoma cell line K1735 clone X-21 after treatment with different concentrations of ara-C for 24 hours. Cellular lysates were processed for determining the levels of TRF1 and TRF2 by Western blotting. Photographs of the autoradiograms are representative of two independent experiments.

