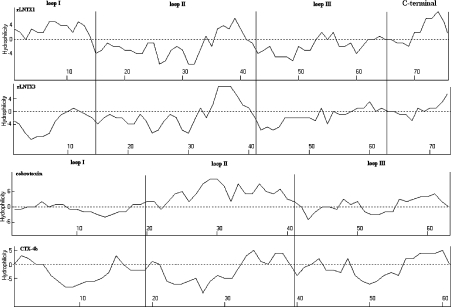
Figure 8. Hydropathy profiles for rLNTX1, rLNTX3, Cbtx and CTX-4b.
Hydropathy profiles were analysed according to the Kyte–Doolittle method [35]. Values above the axis denote hydrophilic regions, whereas those below the axis indicate hydrophobic regions. Analyses were carried out using ANTHEPROT V5.0 (Institut de Biologie et Chimie des Protéines, Lyon, France).

