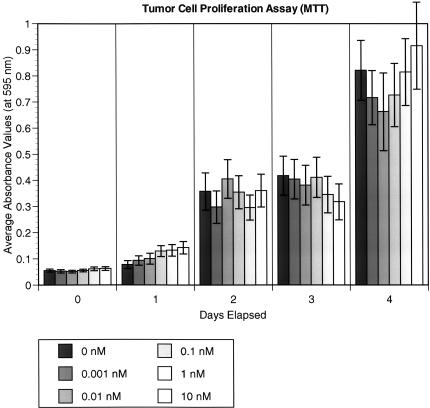
Figure 4.
MTT assay in vitro tumor cell proliferation analyses were carried out on LLHM tumor cells from day 0 to day 4. The y axis absorbency values are proportional to the number of tumor cells. Each color represents a different concentration of TM (ranging from 0 to 10 nM) being added to the LLHM cells. Each bar represents the average of five microtiter well values. The error bars represent standard error. There is no statistically significant difference in tumor cell number noted at any time point and at any concentration of TM.

