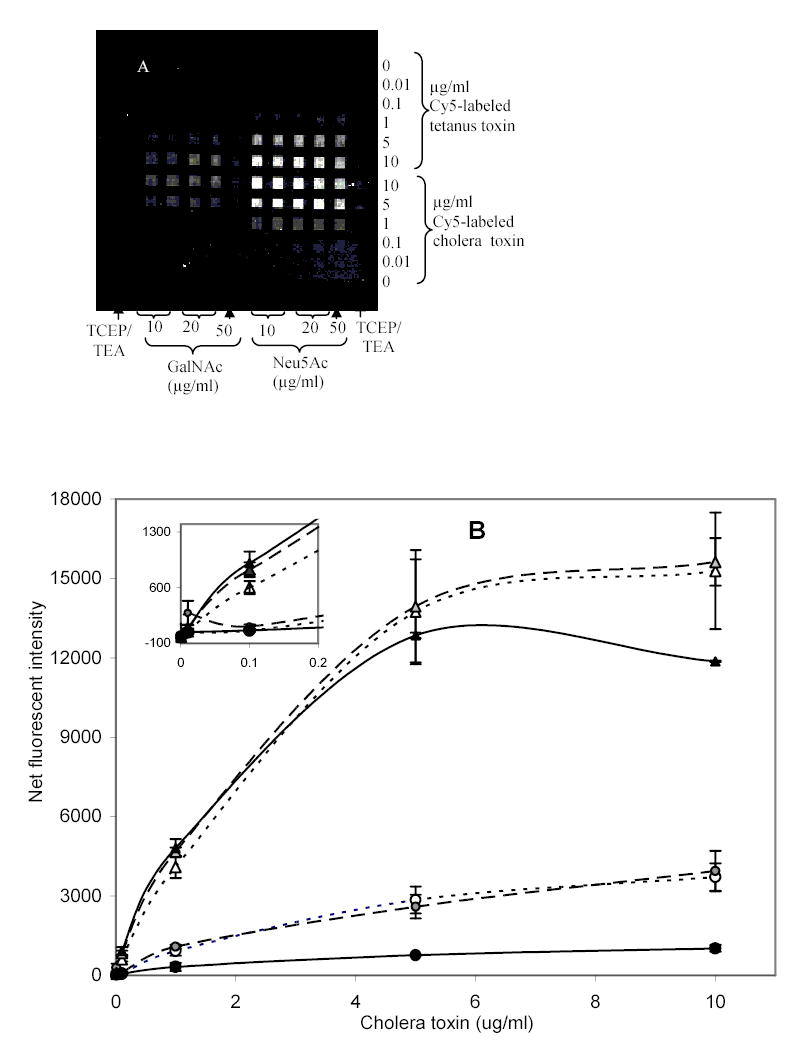
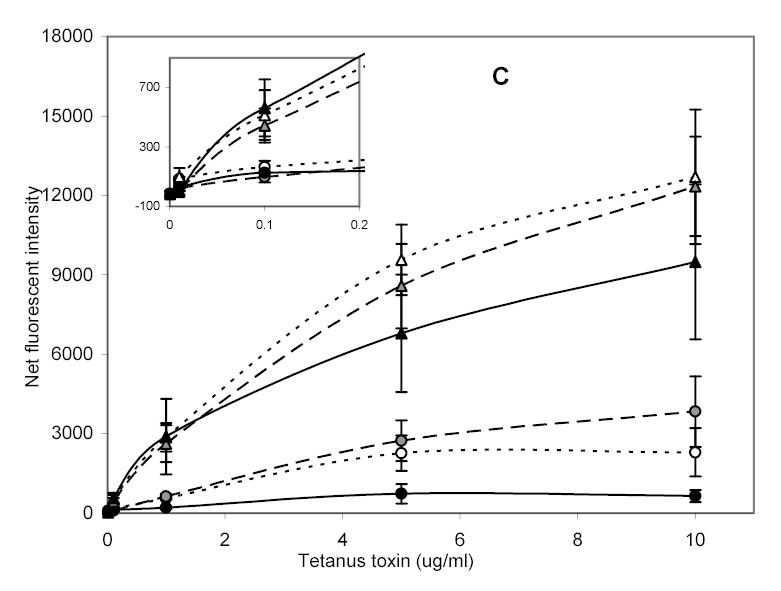
Fig. 3.


Detection of cholera and tetanus toxins with various concentrations of immobilized GalNAc and Neu5Ac derivatives. (a) CCD image of fluorescently-bound toxins assayed over immobilized sugar derivatives for 1 hour under static conditions. Dose-response curves for (b) Cholera toxin, and (c) Tetanus toxin each with: ···▵·· · 10, —◭— 20, —▴— 50 μg/ml patterned Neu5Ac and ···○··· 10, —◍— 20, —•— 50 μg/ml patterned GalNAc. Error bars are standard error of the mean for 2 slides with n=4 total.
