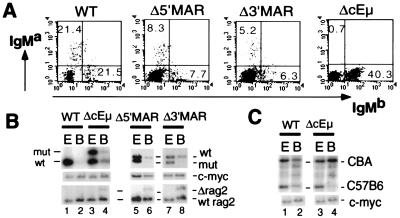
Figure 3.
Analysis of Δ5′MAR, Δ3′MAR, and ΔcEμ mice. (A) Flow cytometric analysis of surface IgMa and IgMb expression by spleen cells from wild-type, Δ5′MAR, Δ3′MAR, and ΔcEμ mice. (B) D to J rearrangement in Δ5′MAR, Δ3′MAR, and ΔcEμ B cells. Genomic DNA from ES cells and purified IgM+ splenic B cells of wild type and mutants was digested with SacI (Δ5′MAR and Δ3′MAR) or Pvu II (ΔcEμ) and subjected to Southern blot analysis as in Fig. 2B. (C) V to DJ rearrangement in Δ5′MAR, Δ3′MAR, and ΔcEμ B cells. Genomic DNA samples from ES cells and purified IgM+ splenic B cells of wild type and mutants was analyzed by Southern blotting as in Fig. 2C.

