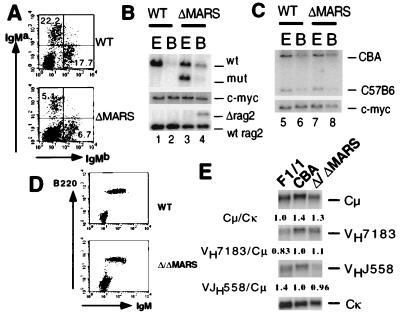
Figure 4.
Analysis of ΔMARS and Δ/ΔMARS mice. (A) Flow cytometric analysis of surface IgMa and IgMb expression by spleen cells from wild-type and ΔMARS mice. (B) D to J rearrangement in ΔMARS B cells. Genomic DNA from ES cells and purified IgM+ splenic B cells of wild type and mutant was digested with SacI and subjected to Southern blot analysis as in Figs. 2B and 3B. (C) V to DJ rearrangement in ΔMARS B cells. Genomic DNA samples from ES cells and purified IgM+ splenic B cells of wild type and mutants were analyzed by Southern blotting as in Figs. 2C and 3C. (D) Flow cytometric analysis of surface IgM and B220 expression by spleen cells from wild-type and Δ/ΔMARS mice. (E) Northern blot analysis of μ chain and VDJH expression by B220+IgM+ spleen B cells from wild-type F1/1 and CBA and Δ/ΔMARS mice. The Cμ/Cκ signal intensity (parental F1/1 cells normalized to 1.0) and the VH7183/Cμ and VHJ558/Cμ intensities (CBA cells to 1.0) are shown below each panel.

