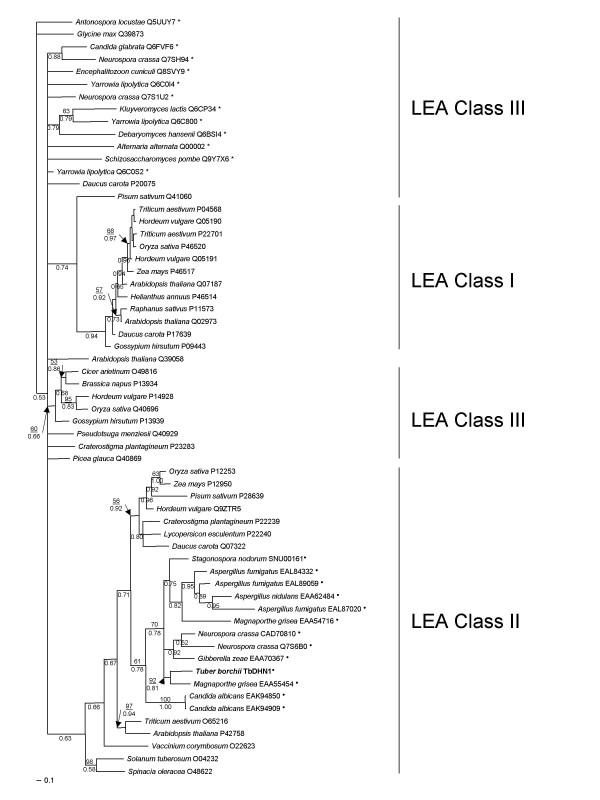
Figure 3.

Bayesian posterior probability tree. Neighbor-Joining bootstrap values, grater than 50%, are shown above branches where available; Bayesian posterior probabilities are shown below branches. A full circle denotes the newly classified sequences, while the other LEA proteins were already classified by Wise [12]. Fungal LEA Class III proteins are marked with an asterisk. Newly generated TbDHN1 sequence is in bold. Bar = posterior probability.
