
Figure 1.
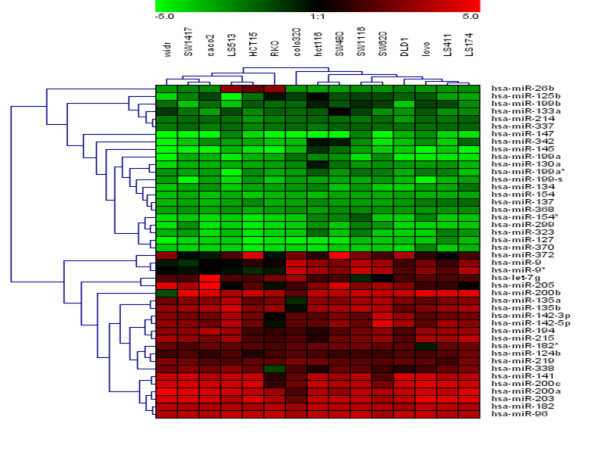
Hierarchical clustering of miRNA in CRC cell lines. 15 CRC cell lines were clustered according to the expression profile of 44 miRNAs differentially expressed and commonly detected with the three different normalization approach used between CRC and normal cell line (average linkage and Euclidean distance as similarity measure). Data from each miRNA were median centered and RQ was determined as described in material and methods. Dendrograms indicate the correlation between groups of samples and genes. Samples are in columns and miRNAs in rows. The expression values ranged from + 5 log10 to - 5 log10.