
Figure 1.
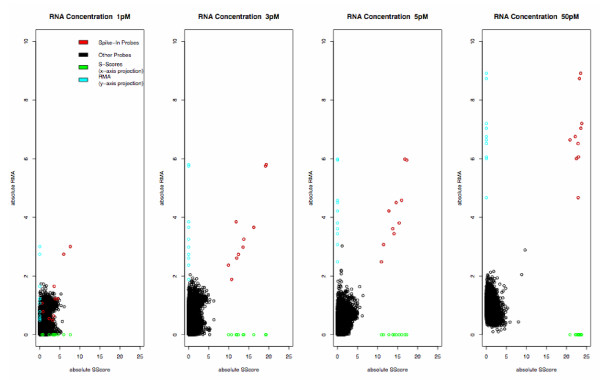
Comparison of S-Score and RMA. Plot of absolute value of S-Score vs absolute value of difference in RMA expression summaries, comparing the specified concentration to the baseline chip. X- and Y-axis projections are added to show separation of spike-in probes more clearly.