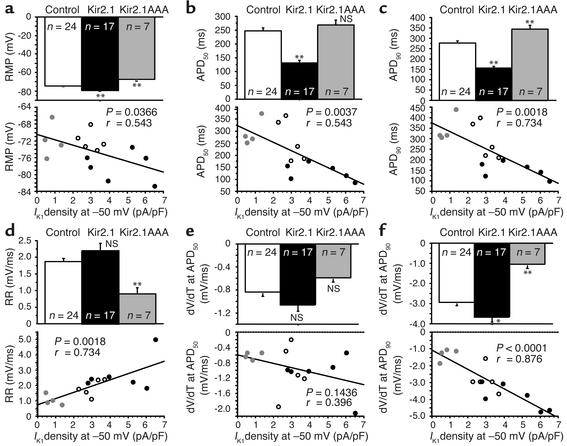
Figure 4.
Correlation analysis of stable AP and repolarization parameters with outward IK1 density obtained at –50 mV. Graphs show (a) RMP; (b) APD at 50% and (c) 90% repolarization from the overshoot to RMP (APD50 and APD90); (d) repolarization rate between APD50 and APD90 (RR), and dV/dT at (e) APD50 and at (f) APD90. Parameters were tested for correlation with IK1 magnitude in the same cell. *P< 0.01;**P<0.005.

