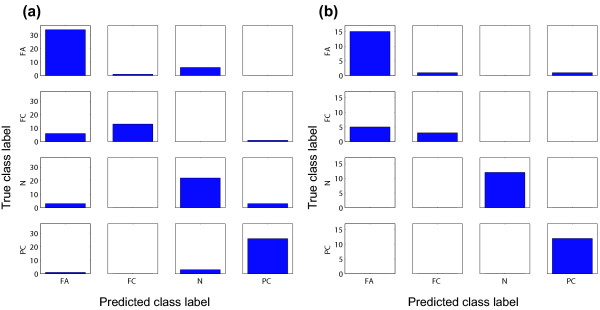
Figure 5.

a) Confusion matrix of the results of the learning set (1A-SHS, evaluated by leave-one-out cross-validation). Each cell shows the number of samples along with true and predicted labels. True and predicted class labels are aligned vertically, and horizontally. b) Confusion matrix of the results of the test set.
