Figure 5.
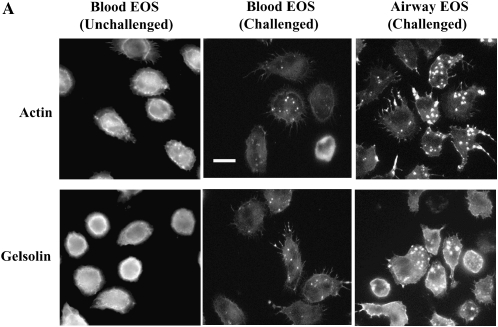
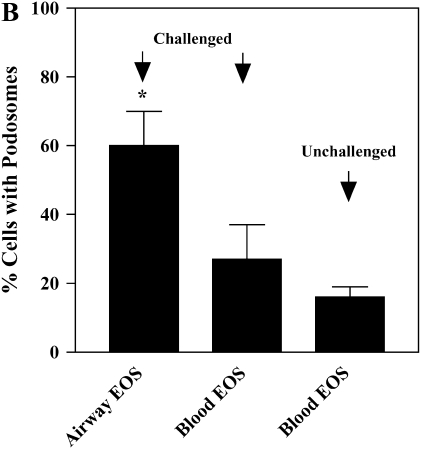
Podosome formation of purified blood and airway EOS. (A) Micrographs of separate fields of purified blood EOS of an unchallenged individual (left), of blood EOS of a challenged individual (middle), or of airway EOS of a challenged individual (right) adherent to VCAM-1 assayed by immunofluorescent staining with rhodamine-phalloidin for actin or anti-gelsolin. Fields representative of experiments with six donors are shown. Scale bar = 10 μm. (B) The percentages of EOS that contain podosomes were calculated. EOS were counted as podosome-positive if they had clear and bright actin condensations. Podosomes were quantified by involved and naïve laboratory workers after visualization of at least 200 EOS in each experiment, and similar results were obtained in all cases. Results represent the mean and SEM from assays performed in triplicate from six separate donors (18 coverslips), *P < 0.05 and P < 0.01, comparing the percentage of airway EOS containing podosomes to blood EOS of challenged or unchallenged individuals, respectively, one-way ANOVA with Tukey-Kramer multiple comparison post test.


