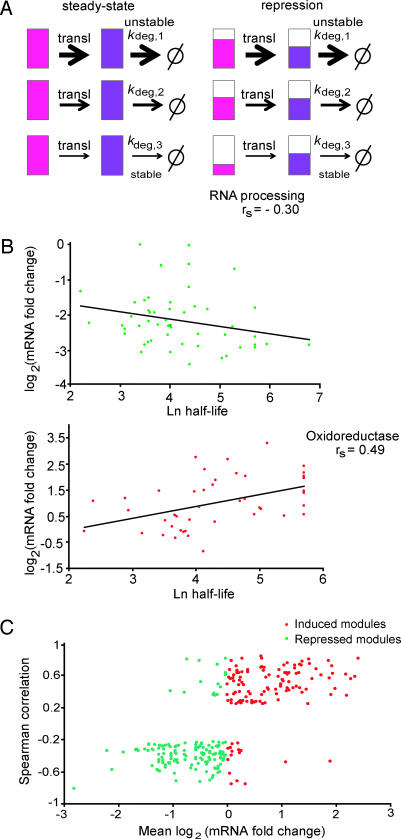
Fig. 5.
Correlation between mRNA changes and protein half-life. (A) Model for buffering protein stability differences in regulated transcription modules. Schematic of a transcription module made up of three genes with different protein degradation rate constants shown at steady state (Left) and during the transition to a repressed state (Right). The three coregulated genes produce mRNA (shown in pink) coding for proteins (in purple) of different stabilities as indicated by the different kdeg (1 is least stable, and 3 is the most stable protein). When the genes in the module are transcriptionally repressed (Right) and the cell is aiming to maintain the same relative ratios of protein abundance as in steady state, mRNAs coding for stable proteins will be repressed more than mRNAs coding for unstable ones (indicated by the relative extent of pink filling). The same is true for cases of induction (data not shown). (B) Relationship between fold change in expression and protein half-life in the genes belonging to two transcription modules. The profile of the RNA processing module in osmotic stress (51 genes; ref. 9) (Upper) and the oxidoreductase module (44 genes; ref. 7) in response to DTT (Lower) are shown. The mRNA data come from the time point of maximum mRNA repression (for osmotic stress, 20 min) or activation (for oxidoreductase, 45 min) during time courses after a stress. The lines give the least-square fit to the data points. (C) Global correlation between protein half-life and fold change in gene expression in transcription modules. For 1,200 previously described transcription modules (10), we analyzed 27 different time courses of mRNA expression after a stress (8, 11–14). For each module and each condition, we tested whether the magnitude of transcription induction or repression correlates with the half-life of the protein encoded by the module’s genes. To that end, we calculated the Spearman rank correlation between fold change in gene expression and protein half-life and collected all module-condition pairs for which the correlation was significant (P < 1e−3). The scatter plot shows the average fold change in expression (x axis) and Spearman rank correlation (y axis) for significant pairs The plot reflects distinct behaviors for induced (red) and repressed (green) modules, suggesting that, in agreement with our theoretical prediction, in cases where correlation between half-life and expression is observed, it increases the uniformity of the module’s response at the protein level.

