Figure 2.
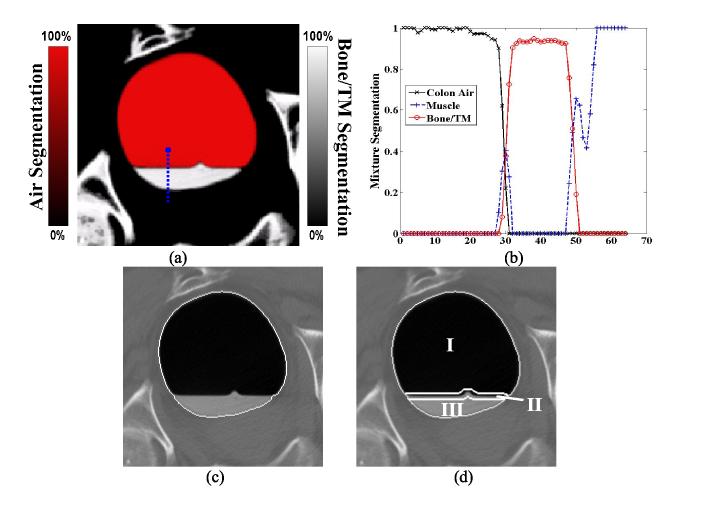
Picture (a) shows the mixture-based PV segmentation result from the corresponding image slice of Figure 1(a). In this picture, the red color (or air space) indicates the segmentation result for the colon air class; the white color (or tagged material space) indicates the segmentation result for the bone/tagged material (TM) class. Between these two colors/spaces is the interface layer. Picture (b) shows the corresponding segmentation profiles along the sample vertical line (or blue color) which is the same as shown in Figure 1(a). In most cases, the PV segmentation provides correct material mixtures in the layers, but in some cases, it may identify an incorrect mixture component. Picture (b) shows an example, where some voxels around location 30 along the vertical profile in the interface layer contain colon tissue component. This error must be corrected. Picture (c) illustrates the border of volume Se (i.e., the entire lumen enclosure). Picture (d) shows the divided regions in the enclosure volume. Region I is the air space Pa, region II is marked as the interface layer space Pm, and region III is the tagged material space Pt .

