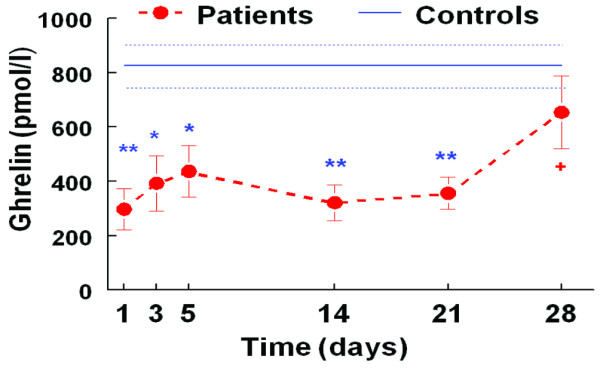
Figure 3.

Pattern of plasma ghrelin (mean ± standard error of the mean) during intensive care unit (ICU) stay (n = 8 patients) compared with healthy age and body mass index matched control group (n = 36). Filled circles, ICU patients; solid line, control group; doted line, error bar in control group; * p < 0.05. ** p < 0.001 patients versus controls. There was no significant difference between patients and control subjects on day 21 and 28. +p <0.05 for patient day 1 versus patient day 28.
