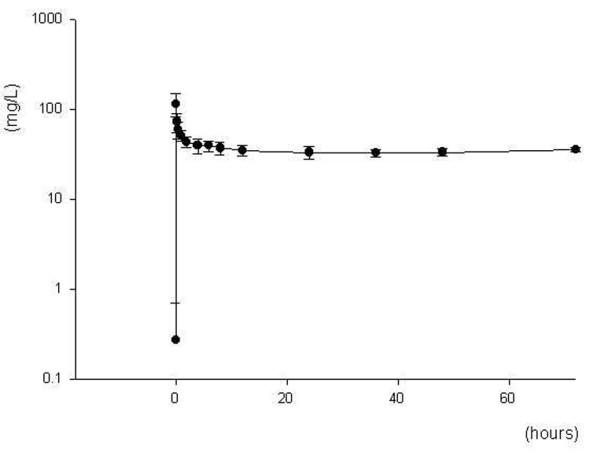
Figure 1.

Ceftazidime concentration-time curve. Shown is a serum concentration-time curve for a 3 g/day continuous infusion of ceftazidime following a 2 g loading dose in seven critically ill patients undergoing continuous venovenous haemodiafiltration. Data points are the mean serum concentrations (± standard deviation) of ceftazidime measured at each time point during the 72-hour study period.
