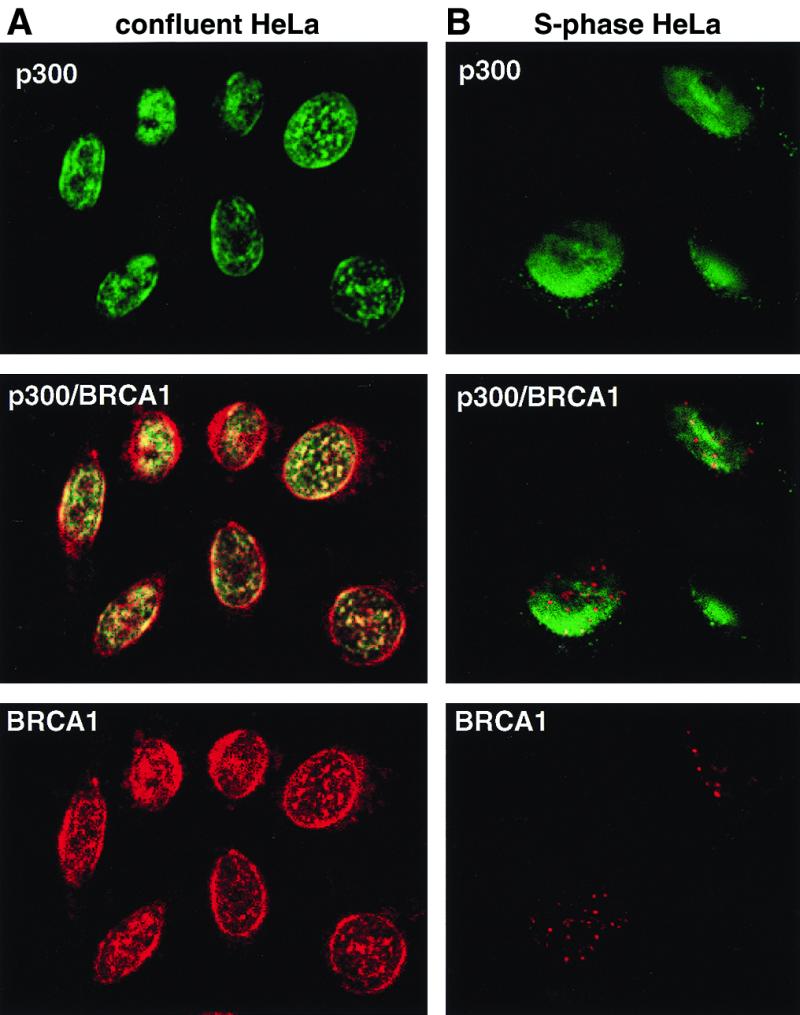
Figure 3.

Colocalization of p300 and BRCA1 by immunofluorescence staining. BRCA1 is stained in red (Texas red) and p300 in green (FITC), while coincident signals are seen in yellow in the merged picture obtained by confocal laser microscopy. (A) A field of confluent HeLa cells. (B) S-phase HeLa cells 4 hr after release from aphidicolin-mediated arrest. Magnifications: ×63.
