
Figure 3.
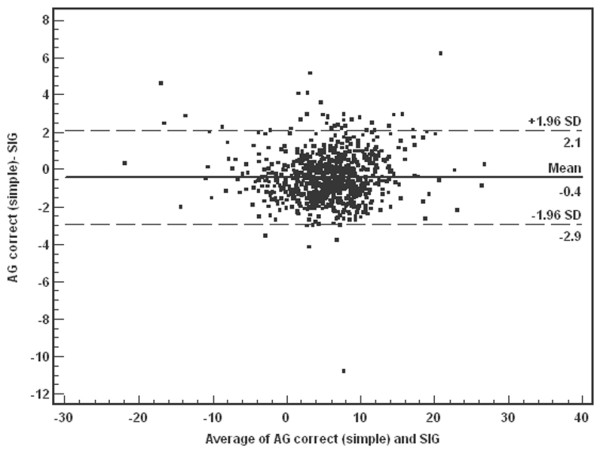
Bland–Altman analysis of simplified corrected anion gap (AGc (simple)) and strong ion gap (SIG). AGc (simple) was calculated in the same was as AGc, but without phosphate. Solid line, mean differences; broken lines, ± 1.96 SD. Mean -0.42, SD 1.28, 95% confidence interval (CI) -0.51 to -0.34. Lower limit of agreement = -2.93, 95% CI -3.08 to -2.79. Upper limit of agreement = 2.08, 95% CI 1.94 to 2.24. This shows good agreement between AGc (simple) and SIG, with only 30 of 851 data points outside 2 SD from the mean.