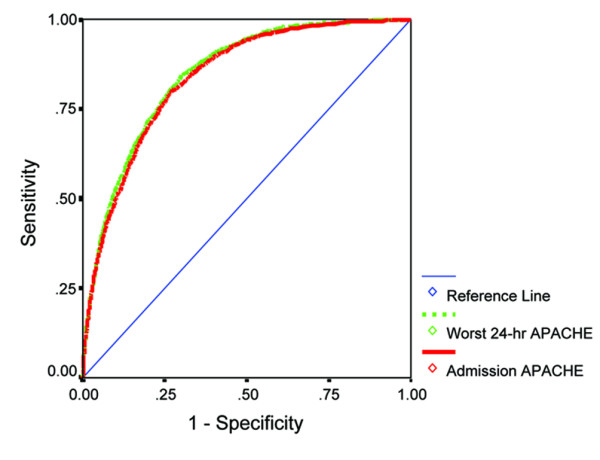
Figure 2.

The receiver operating characteristic (ROC) curves for the admission Acute Physiology and Chronic Health Evaluation (APACHE) II model and the worst 24-hour APACHE II model in predicting hospital mortality. Area under ROC curves: worst 24-hour APACHE II model, 84.6% (95% CI = 83.7–85.5); admission APACHE II model, 83.8% (95% CI = 82.9–84.7). No significant difference between the two areas under the ROC curves (P = 1.00).
