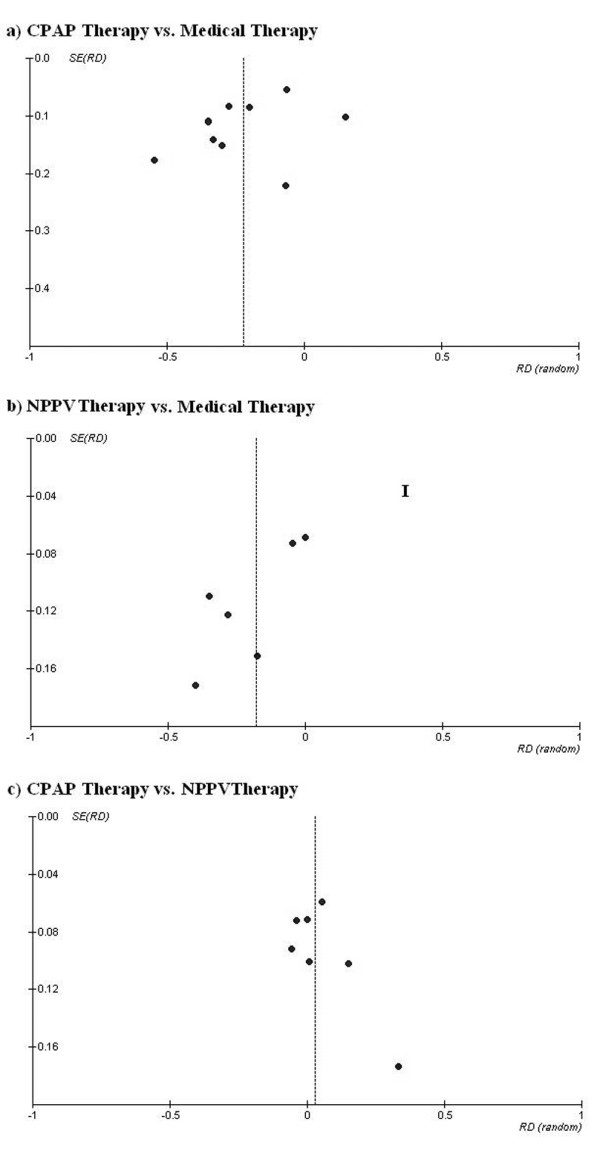
Figure 6.

Funnel plots with effect measures (risk difference (RD)) as a function of its standard error (SE) for the outcome endotracheal intubation in trials comparing (a) continuous positive airway pressure ventilation (CPAP) versus medical therapy; (b) non-invasive positive pressure ventilation (NPPV) versus medical therapy and CPAP versus NPPV.
