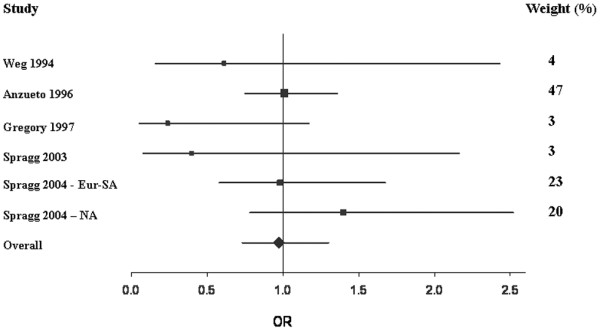
Figure 1.

Forest plot of mortality. This Forest plot represents the odds ratio (OR) (95% confidence interval) for 28-day to 30-day mortality in patients treated with surfactant compared with controls. OR < 1 indicates that treatment with surfactant was associated with a reduction in mortality compared with the control group, while OR > 1 indicates an increase in mortality with surfactant therapy. Areas of boxes are proportional to the respective study weight within the corresponding pooled analysis (see also weight values on the right). Eur-SA, European–South African trial; NA, North American trial.
