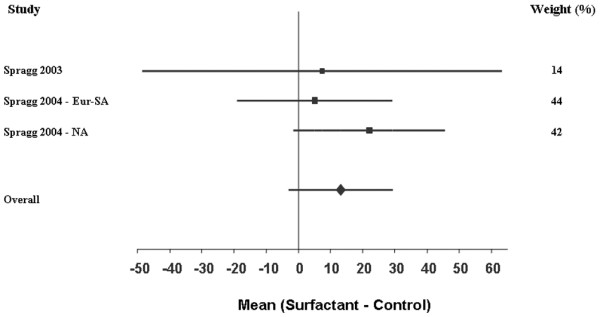
Figure 2.

Forest plot of the PaO2:FiO2 ratio. This Forest plot represents the mean difference in the change in the PaO2:FiO2 ratio (mmHg) of surfactant compared with controls. A positive value (i.e. right of 0) indicates that treatment with surfactant resulted in improved oxygenation at 24 hours compared with controls. Areas of boxes are proportional to the respective study weight within the corresponding pooled analysis (see also weight values on the right). Eur-SA, European–South African trial; NA, North American trial.
