
Figure 1.
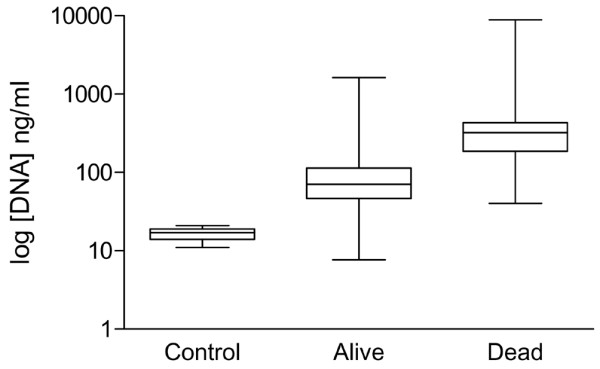
Box and whisker plot for plasma DNA levels between controls and patients who survived or died in the intensive care unit. The box represents a median and interquartile range, whereas the whiskers represent the range.
Official websites use .gov
A
.gov website belongs to an official
government organization in the United States.
Secure .gov websites use HTTPS
A lock (
) or https:// means you've safely
connected to the .gov website. Share sensitive
information only on official, secure websites.
Box and whisker plot for plasma DNA levels between controls and patients who survived or died in the intensive care unit. The box represents a median and interquartile range, whereas the whiskers represent the range.