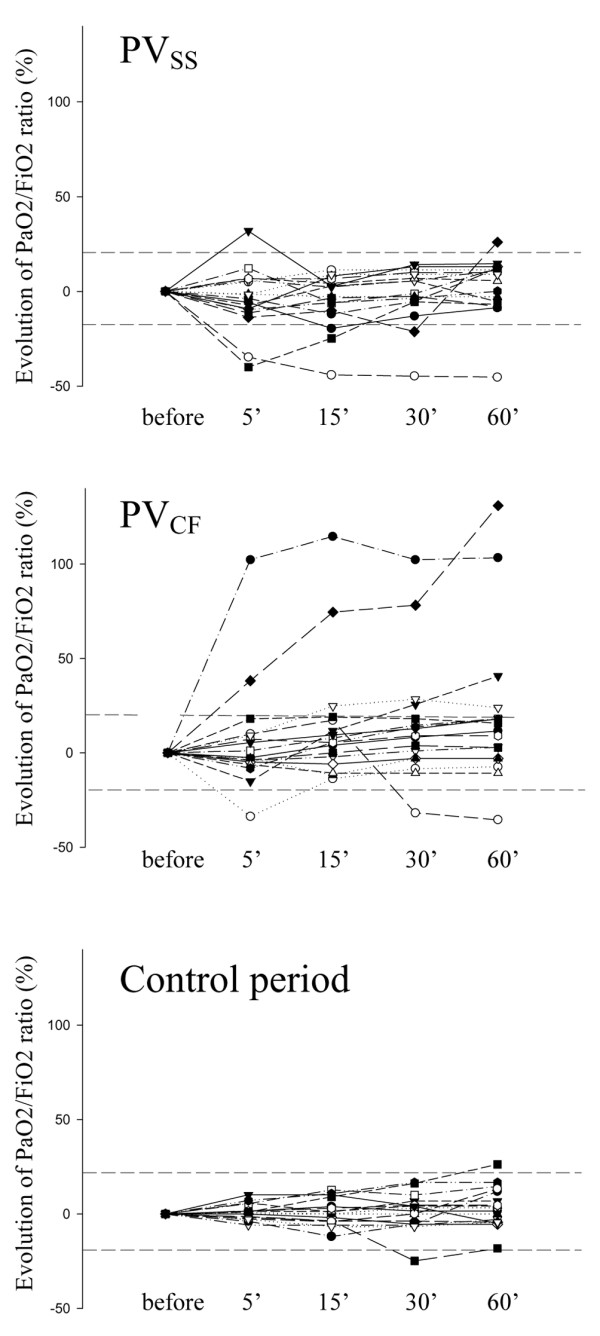
Figure 1.

Evolution over time of Pao2/Fio2 ratio following PV measurements and during a control period. The PV measurements were taken using the super syringe (PVSS) and constant flow method (PVCF). Data are expressed as percentage increase or decrease in Pao2/Fio2 ratio at 5, 15, 30 and 60 minutes as compared with values before PV measurement or the control period. Dashed lines represent 20% increase and decrease as compared with before PV measurement. Fio2, fractional inspired oxygen; Pao2, partial arterial oxygen tension; PV, pressure-volume.
