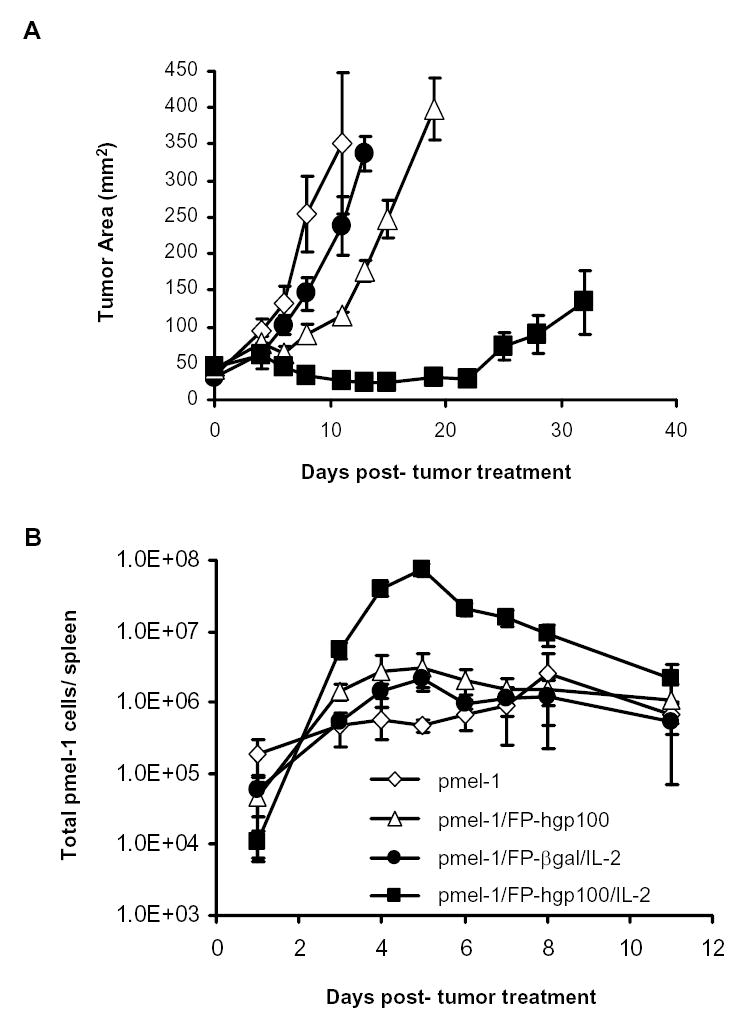
Figure 1.

Kinetics of the expansion of pmel-1 T cells in B16 tumor treatment model. A. Tumor regression by adoptively transfer pmel-1 T cells. Each line represented the mean of measurements from 5 animals per group. Measurements were stopped at point where < 75% of originally treated mice were still surviving. The results shown were representative of three independent identical experiments. B. Population kinetics of transferred pmel-1 transgenic T cells. Cultured pmel-1 T cells were adoptively transferred into B16-bearing mice and given treatments as indicated as described in Materials and Methods. 2–5 mice per group were sacrificed at indicated time points and splenocytes from treated animals were harvested and analyzed for presence of transgenic TCR Vβ13 chain and secondary congenic marker thy1.1. Total transgenic splenocytes = (total average splenocyte count) × (% of Vβ13+/thy1.1+ double-positive splenocytes). Shown values were averaged from 3 experiments of identically treated groups of mice.
