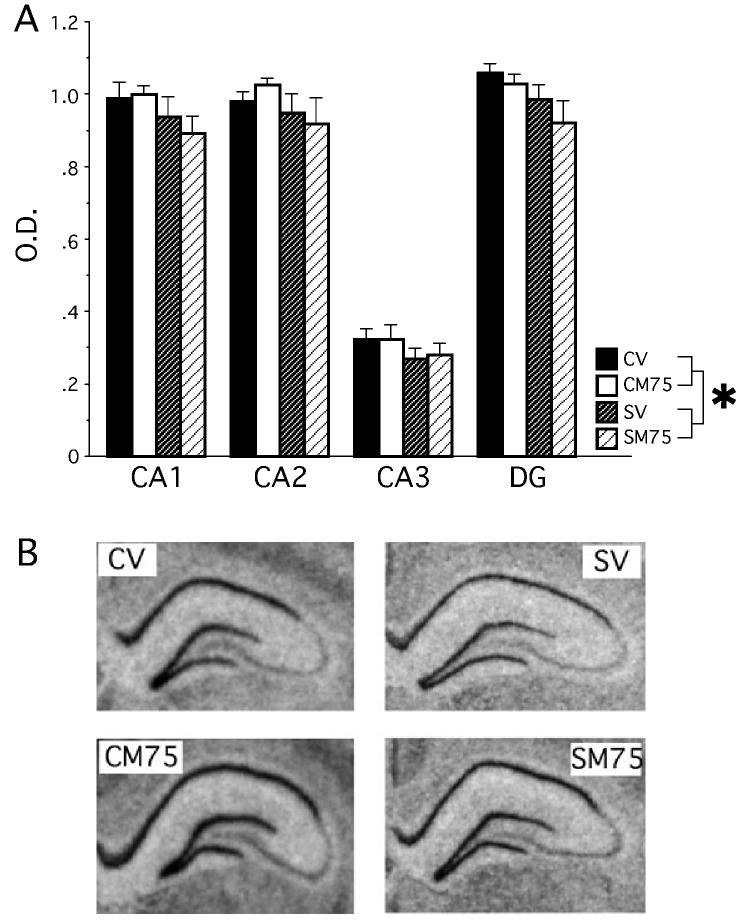
Fig 6.
Experiment 2 – GR mRNA expression within the hippocampus. (A) Chronic stress down-regulated the expression of GR mRNA throughout the hippocampus and this effect was predominately carried by the dentate gyrus and the CA1 regions. Optical density (OD) values represent the mean value of each region after background was subtracted. *P < 0.05 compared to control (CV and CM75). Data represent means ± SEM. (B) Coronal sections of the hippocampus after exposure to film for 16 days. Note the reduced staining in the chronic stress conditions (SV, SM75).

