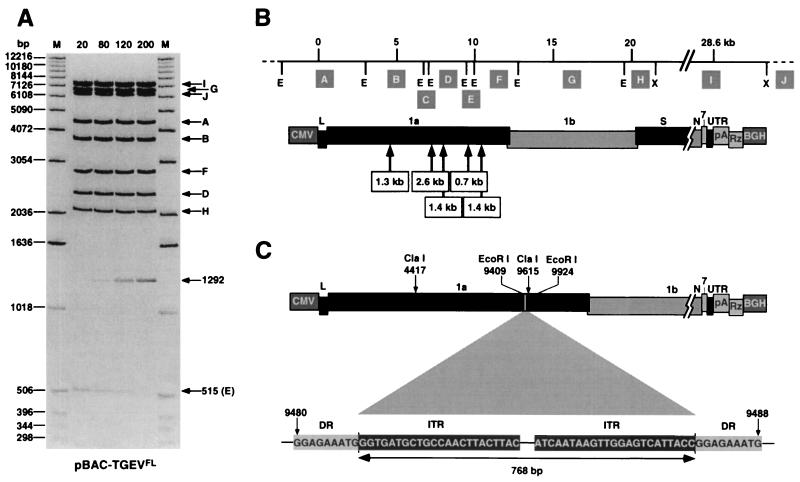
FIG. 2.
Stability of the TGEV full-length cDNA in E. coli cells. (A) EcoRI-XhoI restriction pattern of plasmid pBAC-TGEVFL extracted from E. coli DH10B cells that were grown for the number of generations shown at the top. The DNA bands were observed after ethidium bromide staining. The lower arrow (E) indicates the disappearance of the 515-bp band. The arrow corresponding to a band of 1292 bp shows the appearance of a new band. M, molecular mass markers. Letters on the right (A to J) indicate the restriction endonuclease fragments (see panel B) except fragment C (254 bp), which is not shown in the gel. (B) Sizes and relative positions of fragments inserted in the TGEV full-length cDNA during different repetitions of the stability experiments. Simultaneous insertion of two or more fragments was never observed. The positions of EcoRI (E) and XhoI (X) restriction sites are indicated below the top bar. Letters in shaded boxes (A to J) represent restriction fragments with the following sizes: A, 4,458 bp; B, 3,759 bp; C, 254 bp; D, 2,372 bp; E, 515 bp; F, 2,834 bp; G, 6,671 bp; H, 2,069 bp; I, 7,421 bp; J, 6,357 bp. Dashed lines at the ends of the top bar correspond to pBeloBAC11 vector sequences. (C) Structure of the 768-bp insertion sequence type 1 located between positions 9480 and 9488 of TGEV genome cDNA. The sequences of the direct repeats (DR) of 9 bp originated by the insertion and the inverted terminal repeats (ITR) of 23 bp are shown. Abbreviations are as in Fig. 1.

