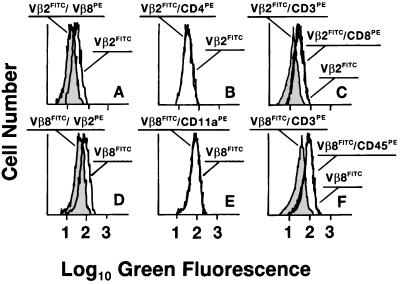
Figure 2.
The two distinct TCRβ chains are neighbors in the plasma membrane of live T cells bearing dual αβTCRs. Spleen T cell lines from Vβ2×Vβ8 double transgenic mice were stained (Upper) with mAb to Vβ2 conjugated with FITC alone or followed by PE-labeled mAb against either Vβ8, CD3, CD4, or CD8. Alternatively (Lower), cells were stained with FITC-conjugated anti-Vβ8 mAb alone or followed by PE-labeled mAb against either Vβ2, CD3, CD11a, or CD45. Flow cytometry analyses of average donor quenching (10, 31) measure the putative reduction in the green FITC fluorescence emission on the surface of viable T cells promoted by neighbor PE-acceptor molecules (10, 31). In cells stained with the two anti-TCRVβ mAbs (A and D), the FITC fluorescence distribution was reduced as indicated by the shift to the left in the presence of the quenching, reciprocal anti-TCRVβ mAb (shaded histograms). Both TCRβ chains were also in the vicinity of CD3 subunits (shaded histograms in C and F). Histograms for TCRVβ staining in the presence and absence of the PE-labeled mAb against CD4, CD8, CD11a, and CD45 instead are superimposed. The ratio of Vβ2 to Vβ8 mean fluorescence intensity ranged from 1:1 to 2:3 in samples from several mice. Similar results were observed for tetraplicate samples in three independent experiments as well as in analyses of freshly isolated spleen and thymus cells (data not shown).

