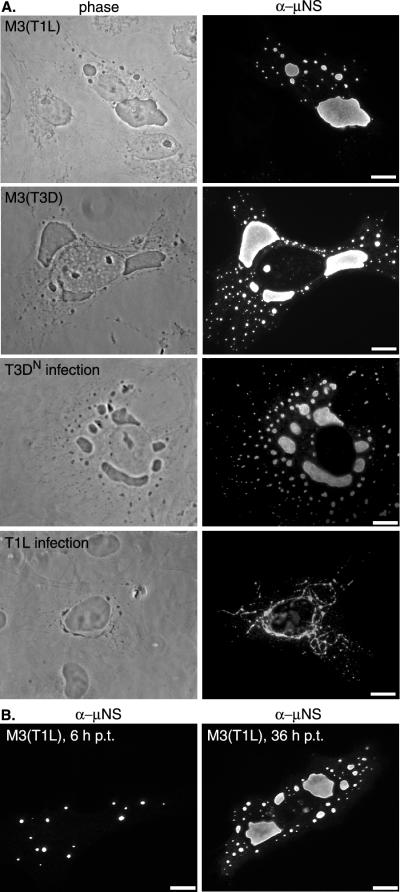
FIG. 1.
Distribution of μNS in transfected and reovirus-infected cells. (A) Phase-contrast microscopy (left column) and IF microscopy (right column) of CV-1 cells transfected (upper four panels) with 2 μg of pCI-M3(T1L) or pCI-M3(T3D) per well or infected (lower four panels) with T3DN or T1L at a multiplicity of infection of 5. The cells were fixed at 18 h p.t. or p.i. and immunostained with rabbit anti-μNS IgG directly conjugated to Texas red (T3DN and T1L infection) or Oregon green [pCI-M3(T3D) transfection] or immunostained with rabbit anti-μNS serum followed by goat anti-rabbit IgG conjugated to Alexa 488 [pCI-M3(T1L) transfection]. (B) CV-1 cells transfected with 2 μg of pCI-M3(T1L) per well were fixed at 6 h p.t. (left) or 36 h p.t. (right) and immunostained with Oregon green-conjugated anti-μNS rabbit IgG. Bars, 10 μm.

