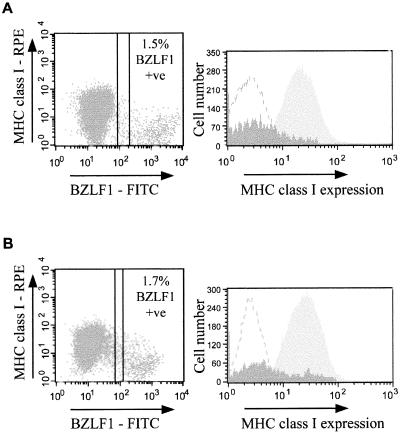
FIG. 1.
Downregulation of MHC class I expression in EBV lytic infection. (A) Surface expression of MHC class I molecules on the latency III and lytic EBV-positive BL cell line Ag876. Viable cells were stained with antibody W6/32 (IgG2a isotype, anti-HLA-A, -B, and-C) and then fixed and permeabilized to allow staining with antibody BZ.1 (IgG1 isotype, anti-BZLF1 immediate-early EBV antigen), followed by detection with a pool of FITC-conjugated anti-IgG1 and RPE-conjugated anti-IgG2a secondary antibodies. The left-hand panel is a dot plot of the flow cytometry results of RPE staining (surface MHC class I molecules) (y axis) and FITC staining (nuclear BZLF1) (x axis). The right-hand panel is a histogram of the RPE staining (surface MHC class I molecules) of the latent, BZLF1− population (light shading) and the lytic, BZLF1+ population (dark shading). The MFI of surface MHC class I expression on the latent, BZLF1− cells is 24, whereas the corresponding MFI for the lytic, BZLF1+ cell population is 5. Results shown are representative of four independent experiments. (B) Surface expression of MHC class I molecules on the normal EBV-transformed LCL Eli-LCL. Immunofluorescence staining and analysis were performed exactly as for the Ag876 cells in panel A. In this representative experiment, the MFI of surface MHC class I expression obtained for the latent, BZLF1− cells was 28, and the corresponding MFI for the lytic, BZLF1+ cells was 8.

