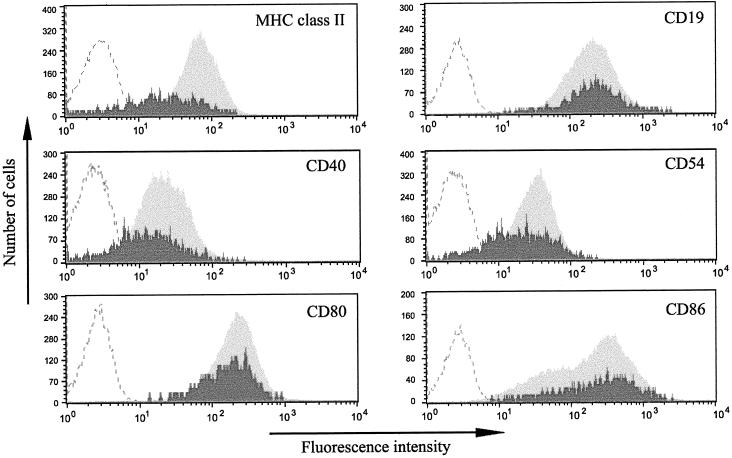
FIG. 2.
Analysis of cell surface protein expression in the lytic cycle. Ag876 cells were stained with antibodies specific for a range of cell surface antigens (for MHC class II, MAb WR18; for CD19, MAb BU.12; for CD40, MAb LOB7/6; for CD54, MAb 15.2; for CD80, MAb L307.4; and for CD86, MAb FUN-1) and labeled with RPE, together with MAb BZ.1 against the BZLF1 immediate-early EBV antigen, labeled with FITC. A representative flow cytometry analysis is shown for each combination of antibodies. Dark shading represents cell surface antigen staining on lytic, BZLF1+ cells; light shading represents cell surface antigen staining on latent, BZLF1− cells; curves defined by dashed lines represent the background RPE fluorescence obtained on cells stained with control antibodies.

