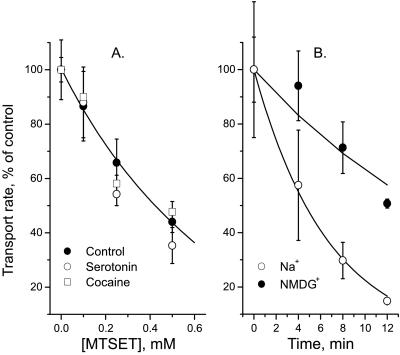
Figure 3.
Effect of ligands and Na+on inactivation of I179C. (A) Cells expressing SERT I179C were incubated for 10 min with the indicated concentration of MTSET in PBS with no addition (●), 16 μM 5-HT (○), or 16 μM cocaine (□). Cells were washed free of MTSET and ligand and assayed for 5-HT transport in PBS. (B) Cells expressing SERT I179C were incubated for the indicated time with 1 mM MTSET in PBS (○) or Na+-free (NMDG) PBS (●). After rinsing with PBS, cells were assayed for transport in PBS.

