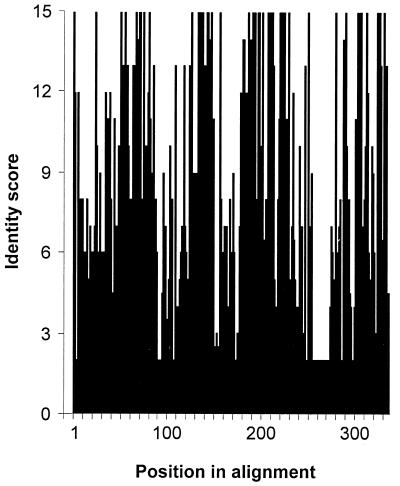
FIG. 3.
Variations in the level of sequence identity along E1A. Protein sequences were aligned (Fig. 2), and the plurality of the consensus sequence was calculated as described in Materials and Methods and plotted as a function of the amino acid position. Note that gaps introduced during the alignment are reflected in the numbering of the consensus sequence, which therefore does not correspond to any of the individual sequences. The axis on the left indicates the number of sequences out of 15 that were identical. A nonintegral value indicates that two or more different amino acids were equally prevalent at a given position.

