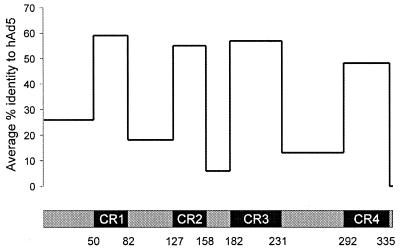
FIG. 4.
Graph of average sequence identities along E1A. Four CR within the E1A sequences were identified as described in Materials and Methods. The percent identity of each adenoviral E1A sequence to that of hAd5 was calculated for each of the indicated regions and averaged. Note that hAd2 E1A was excluded from these calculations as it is virtually identical to that of hAd5.

