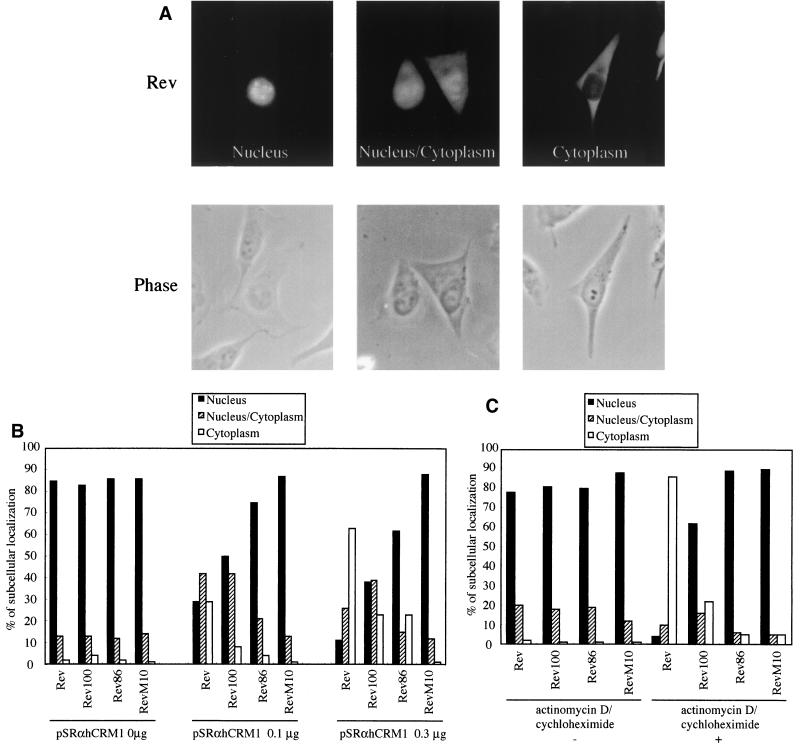
FIG. 3.
The lower export rate of C-terminally truncated mutant proteins. (A) Representative staining pattern of cells transfected with Rev expression plasmids. The cells were classified into three categories based on the localization patterns of Rev: nucleus, nucleus/cytoplasm, and cytoplasm. Phase-contrast images are shown below the immunofluorescence images. (B) Quantitative analysis of the subcellular localization of wild-type and mutant Rev proteins under conditions of overexpression of hCRM1. HeLa cells were transfected with wild-type or mutant Rev expression plasmids along with various amounts of pSRαhCRM1. At 24 h posttransfection indirect immunofluorescence analysis was performed. The cells were classified into categories as described above, and more than 200 stained cells were counted, and percentages were calculated. The data presented are representative of two independent sets of experiments. (C) Subcellular localization of wild-type and mutant Rev proteins in the presence of actinomycin D and cycloheximide. HeLa cells were transfected with wild-type or mutant Rev expression plasmids. At 20 h posttransfection cells were treated with a solvent control (actinomycin D/cycloheximide −) or 10 μg of actinomycin D per ml and 50 μg of cycloheximide (actinomycin D/cycloheximide +) per ml for 4 h, and immunofluorescence staining was performed. These data are representative of two independent sets of experiments.

