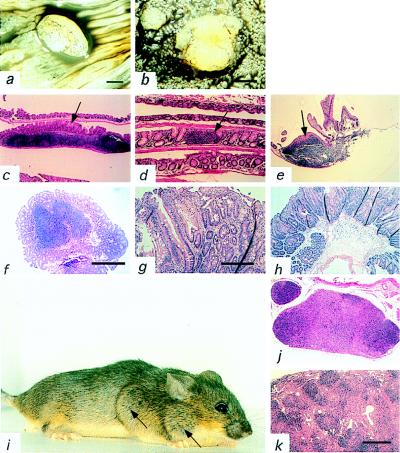
Figure 4.
Gross and histological appearance of gut polyps and lymphoid hyperplasia. (a and b) The gastrointestinal tract was cut longitudinally along the antimesenteric border and cleaned. Polyps were visualized by eye and then inspected with a dissecting microscope. Contrast was enhanced with india ink. (a) A 5-mm polyp (×6) at the colorectal boundary. (b) Two polyps in the jejunum of diameters of 2.5 and <1 mm (×20). (c–e) Clean mouse intestines were rolled and embedded in paraffin, sectioned, and stained with hematoxylin and eosin. Arrow indicates luminal side of the lymphoid aggregate. (c) Lymphoid aggregate in the colon of the wild-type mouse (×100). (d) Lymphoid aggregate in the small intestine of the wild type (×40). (e) Lymphoid aggregate in the small intestine of the heterozygous mouse (×100). Note association of polyp growth with the Peyer’s patch. (f) A pedunculated polyp of the colon with hyperplasia and a lymphoid aggregate in the center (×40). (g) Hyperplastic polyp of the jejunum (×100). (h) Retention polyp of the colon (×40). (i) Pten+/− female with lymphadenopathy of neck and axilla (arrows). (j and k) Paraffin sections of (j) paracortical and medullary effacement and (k) paracortical effacement and follicular hyperplasia of the heterozygous mice (×40).

