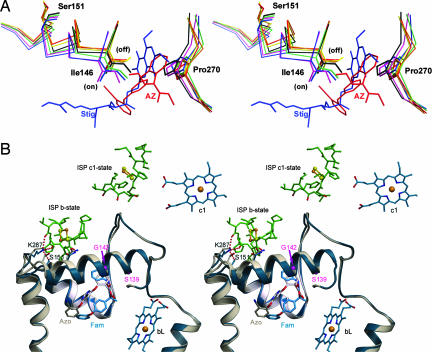
Fig. 2.
Motions observed in the cd1 helix and in the ef loop in the presence of two types of inhibitors. (A) Impact of inhibitors on the conformation of the cd1 switch at the Qo site are illustrated by this stereoscopic pair. Part of the cd1 helix and the P270 of the PEWY motif with and without bound inhibitors are shown by the stick models. Colors are as follows: native (black), stigmatellin (blue), famoxadone (green), UHDBT (magenta), azoxystrobin (red), myxothiazol (orange), and MOAS (yellow). Upon binding of different types of inhibitors, such as stigmatellin (Stig; blue molecule) or azoxystrobin (AZ; red molecule), I146 along with the entire cd1 helix moves either into the on or off position. (B) Stereo pair showing the structural features of the cd1 switch in ribbon form. The structure with famoxadone (Fam) is in blue, and that with azoxystrobin (Azo) is in gray. The inhibitors azoxystrobin and famoxadone are shown as stick models and as labeled. The side chains of K287 and S151 are shown in stick models with the dashed lines indicating H-bonds. H-bonds are also formed between K287 and residues from the ISP-ED when the cd1 switch is at the on position (blue model). In the native structure, or in inhibitor structures in which the ISP-ED is in a free or c1-state (8), no H-bond is formed between K287 and S151 (gray model).

