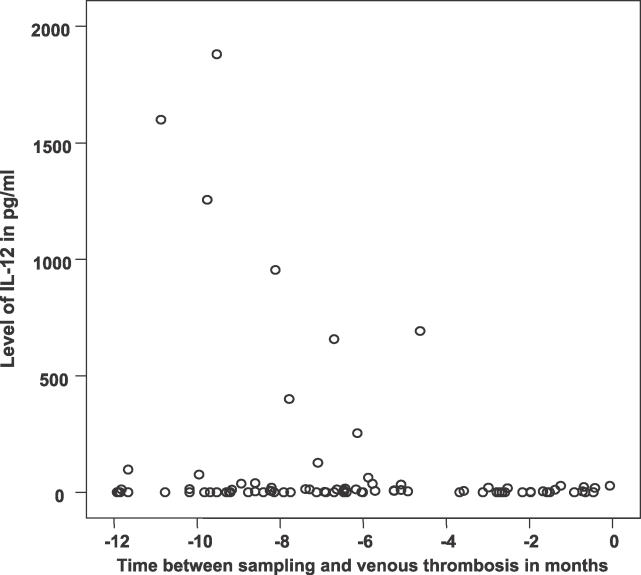
Figure 1. Regression Analysis of the Levels of IL-12 in the 12-mo Period before a Thrombotic Event (p = 0.04).
The y-axis shows levels of IL-12 from 85 individuals. The x-axis shows IL-12 levels for those individuals for whom data were available between sampling and thrombotic event. Note that IL-12 levels do not show a tendency to be increased when they are measured closer to the thrombotic event; in fact, the opposite appears to be the case.

